
/chart
Price chart with optional technical indicators.
Generates a candlestick chart for the ticker with technical analysis overlays. Default interval: daily (1d).
Preview
Preview
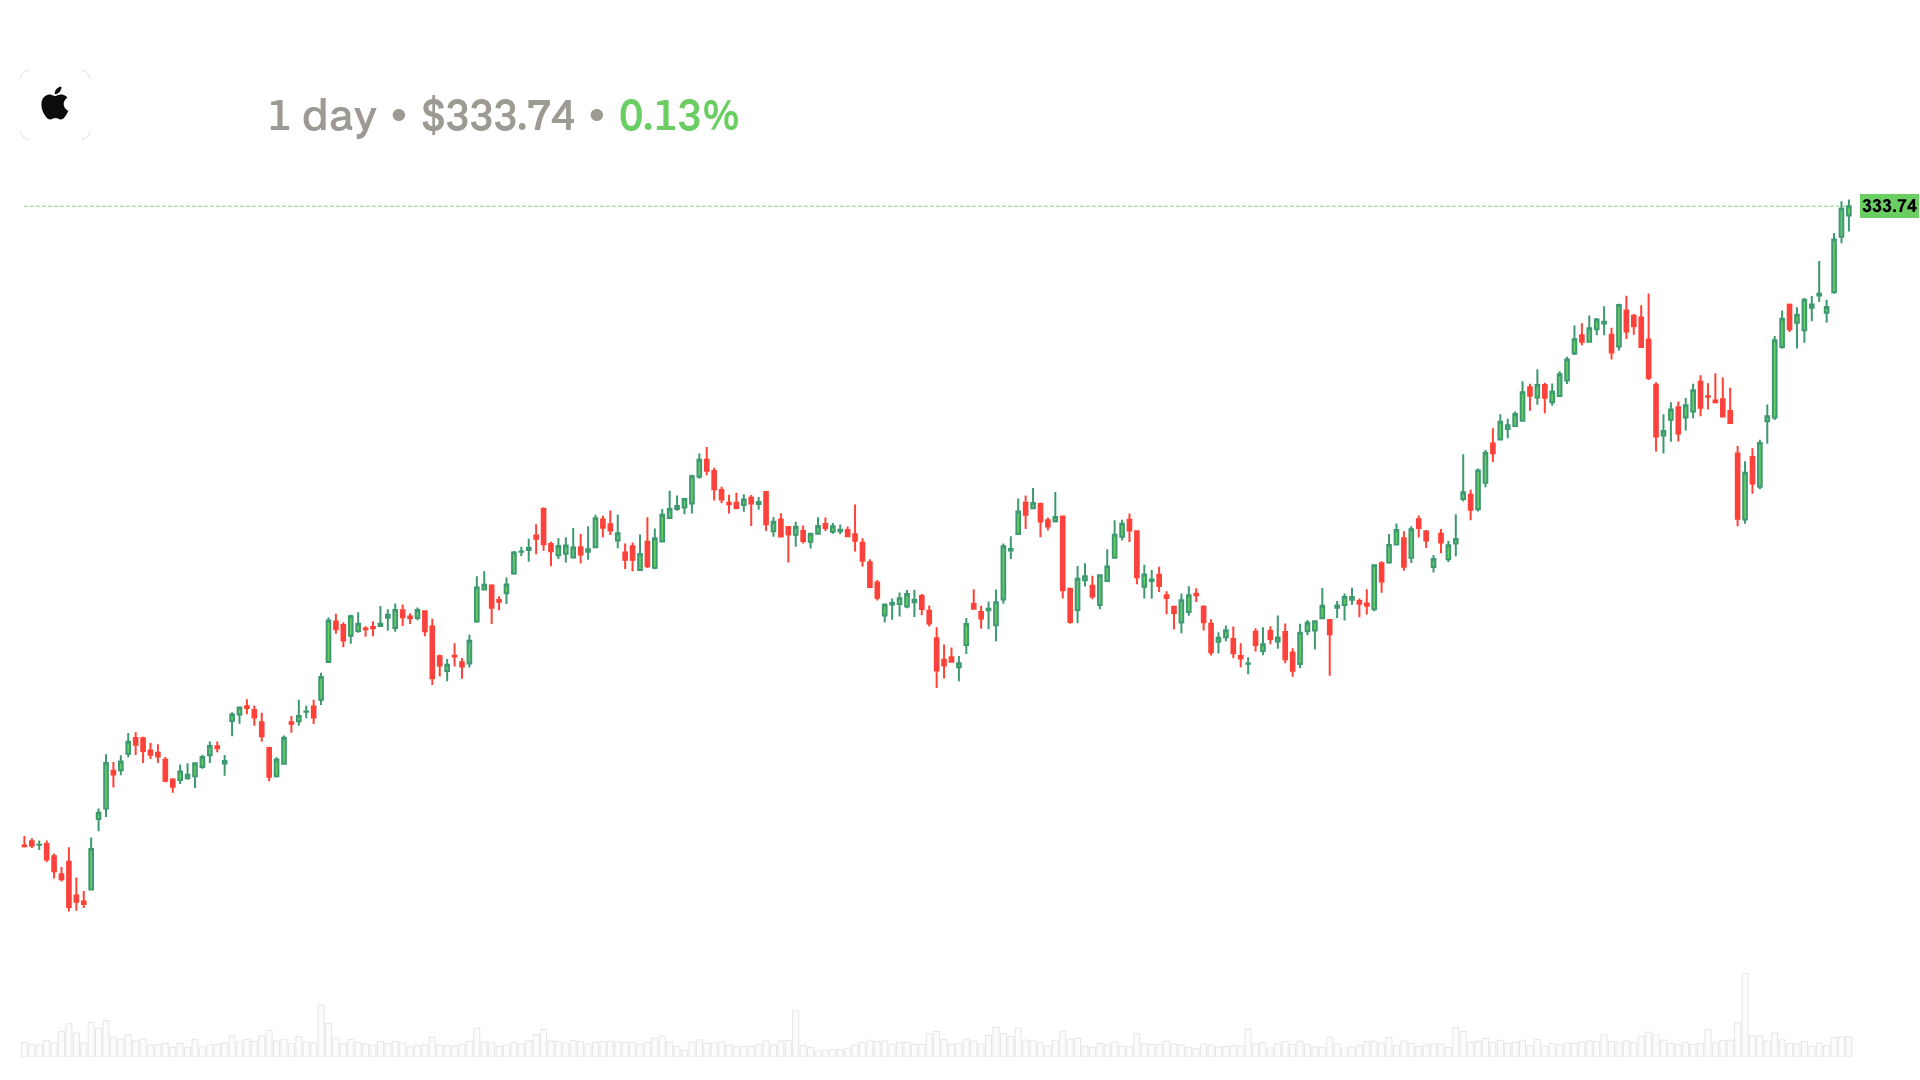
TrendVisionBotToday at 9:30 AM
📎chart.png
How to use
/chart <symbol> [interval]| Form | Syntax |
|---|---|
| Slash | /chart |
| Prefix | ;chart |
Parameters
| Parameter | Required | Values | What it does |
|---|---|---|---|
symbol | Yes | US ticker | Stock queried |
interval | No | 1m · 5m · 15m · 30m · 45m · 1h · 4h · 1d · 1w · 1M | Timeframe (default 1d) |
Examples
/chart NVDA
/chart TSLA 1h
/chart SPY 15m
What you get
PNG image in the channel with candles, volume, and TA overlays.
Related commands
/info— summary snapshot/technical-analysis(/ta) — levels in text (coming soon)
Notes
- Server channel only.
- Invalid interval falls back to default
1d.