
/relative-volume
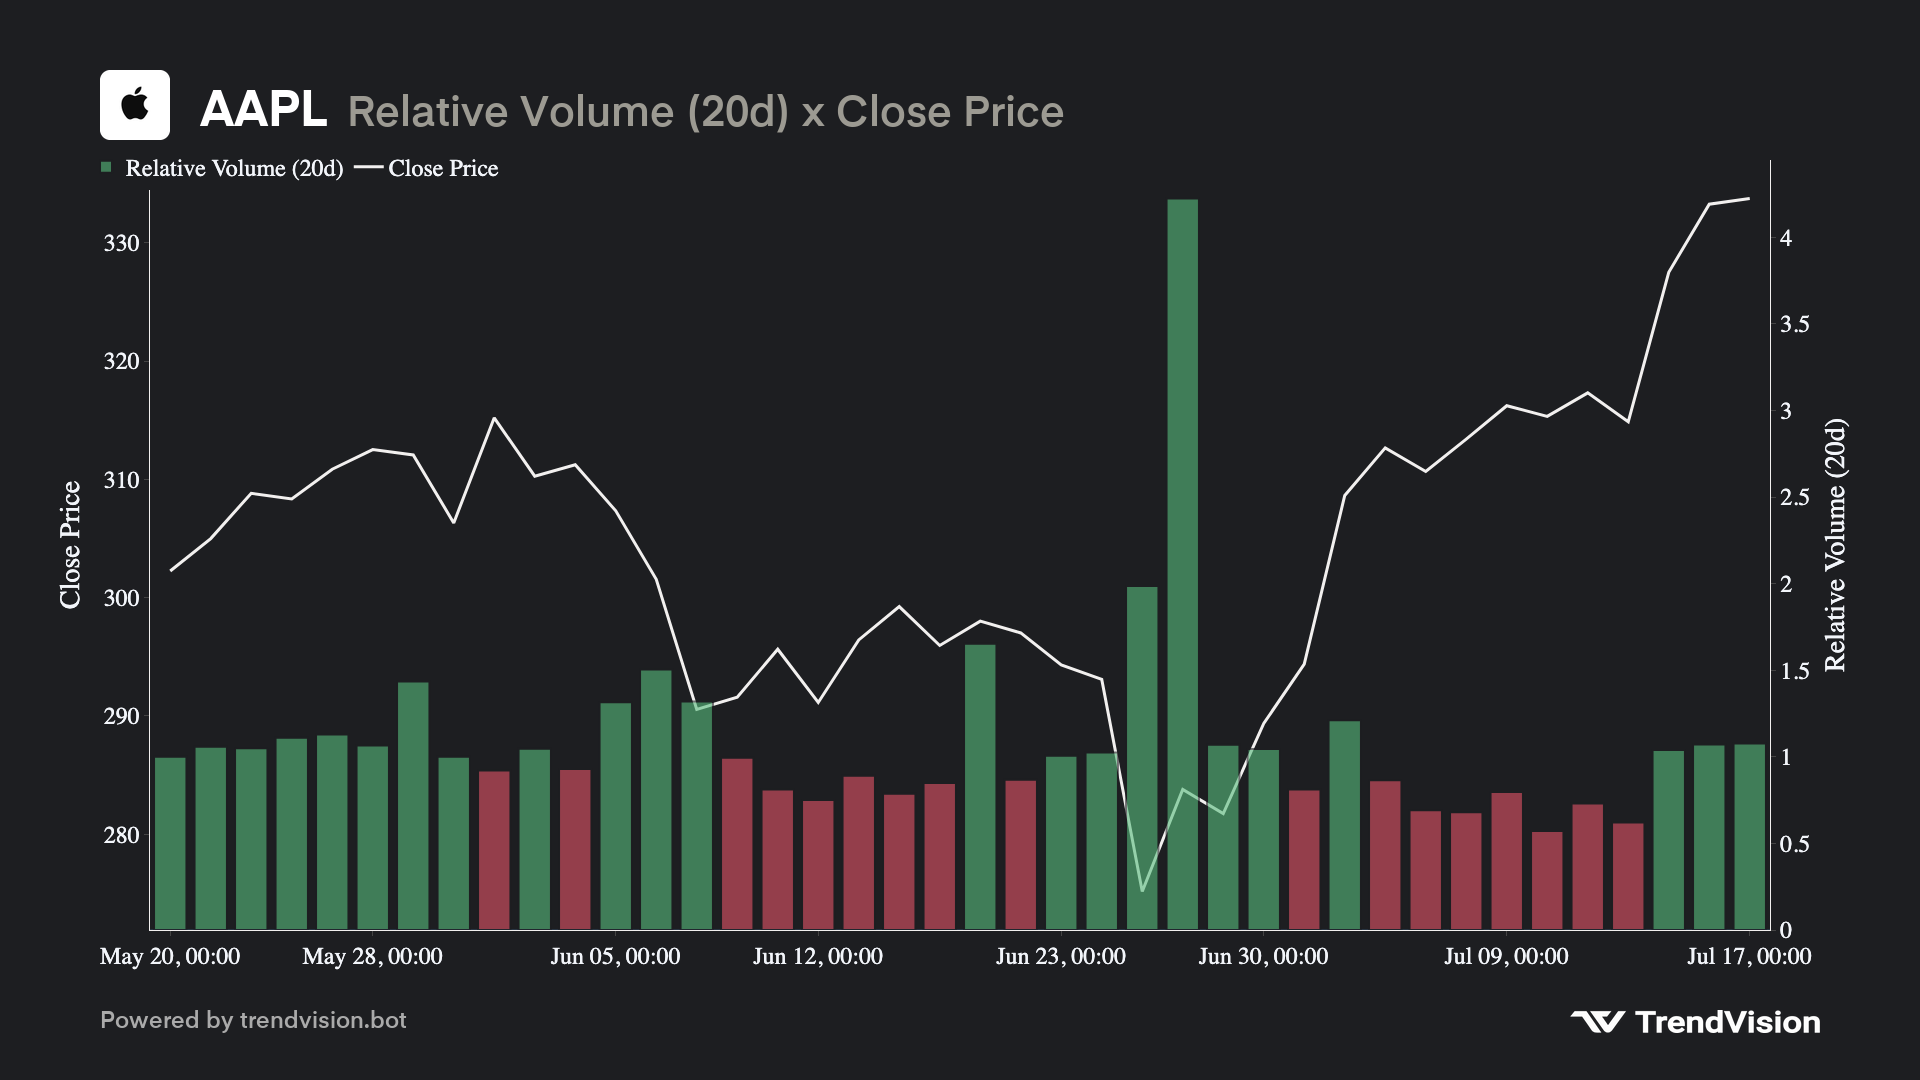
Relative volume vs close price over the past 60 days.
Compares relative volume vs the ~20-day average over about the last 60 days, plotted next to the close price — useful for spotting unusual multi-day volume stretches.
Preview
Preview
TrendVisionBotToday at 9:30 AM
📎relative-volume.png
How to use
/relative-volume <symbol>| Form | Syntax |
|---|---|
| Slash | /relative-volume |
| Prefix | ;relative-volume or ;rvol |
Parameters
| Parameter | Required | Accepted values | What it does |
|---|---|---|---|
symbol | Yes | US ticker (AAPL, NVDA, SOFI, …) | Stock you want to chart. |
Examples
/relative-volume NVDA
/relative-volume GME
;rvol TSLA
What you get
PNG image in the channel — dual-axis chart over the last 60 days.
| Layer | Meaning |
|---|---|
| Close Price (line, left axis) | Daily close |
| Relative Volume 20d (bars, right axis) | Cumulative volume vs 20-day average — color-coded by intensity |
Bars above 1.0 mean volume is running hotter than the 20-day norm for that point in the session.
Related commands
/volume-report(/vr) — short volume breakdown by exchange/info— today's volume inline/technical-analysis(/ta) — 7/14/30-day average volume
Notes
- Server channel only.
- Uses cumulative relative volume (intraday pace vs historical average).