
/shares-evolution
Share count evolution — free float vs restricted shares over time.
Stacked bar chart showing how free float and restricted shares changed over time. Only dates where the share count actually changed are shown.
Preview
Preview
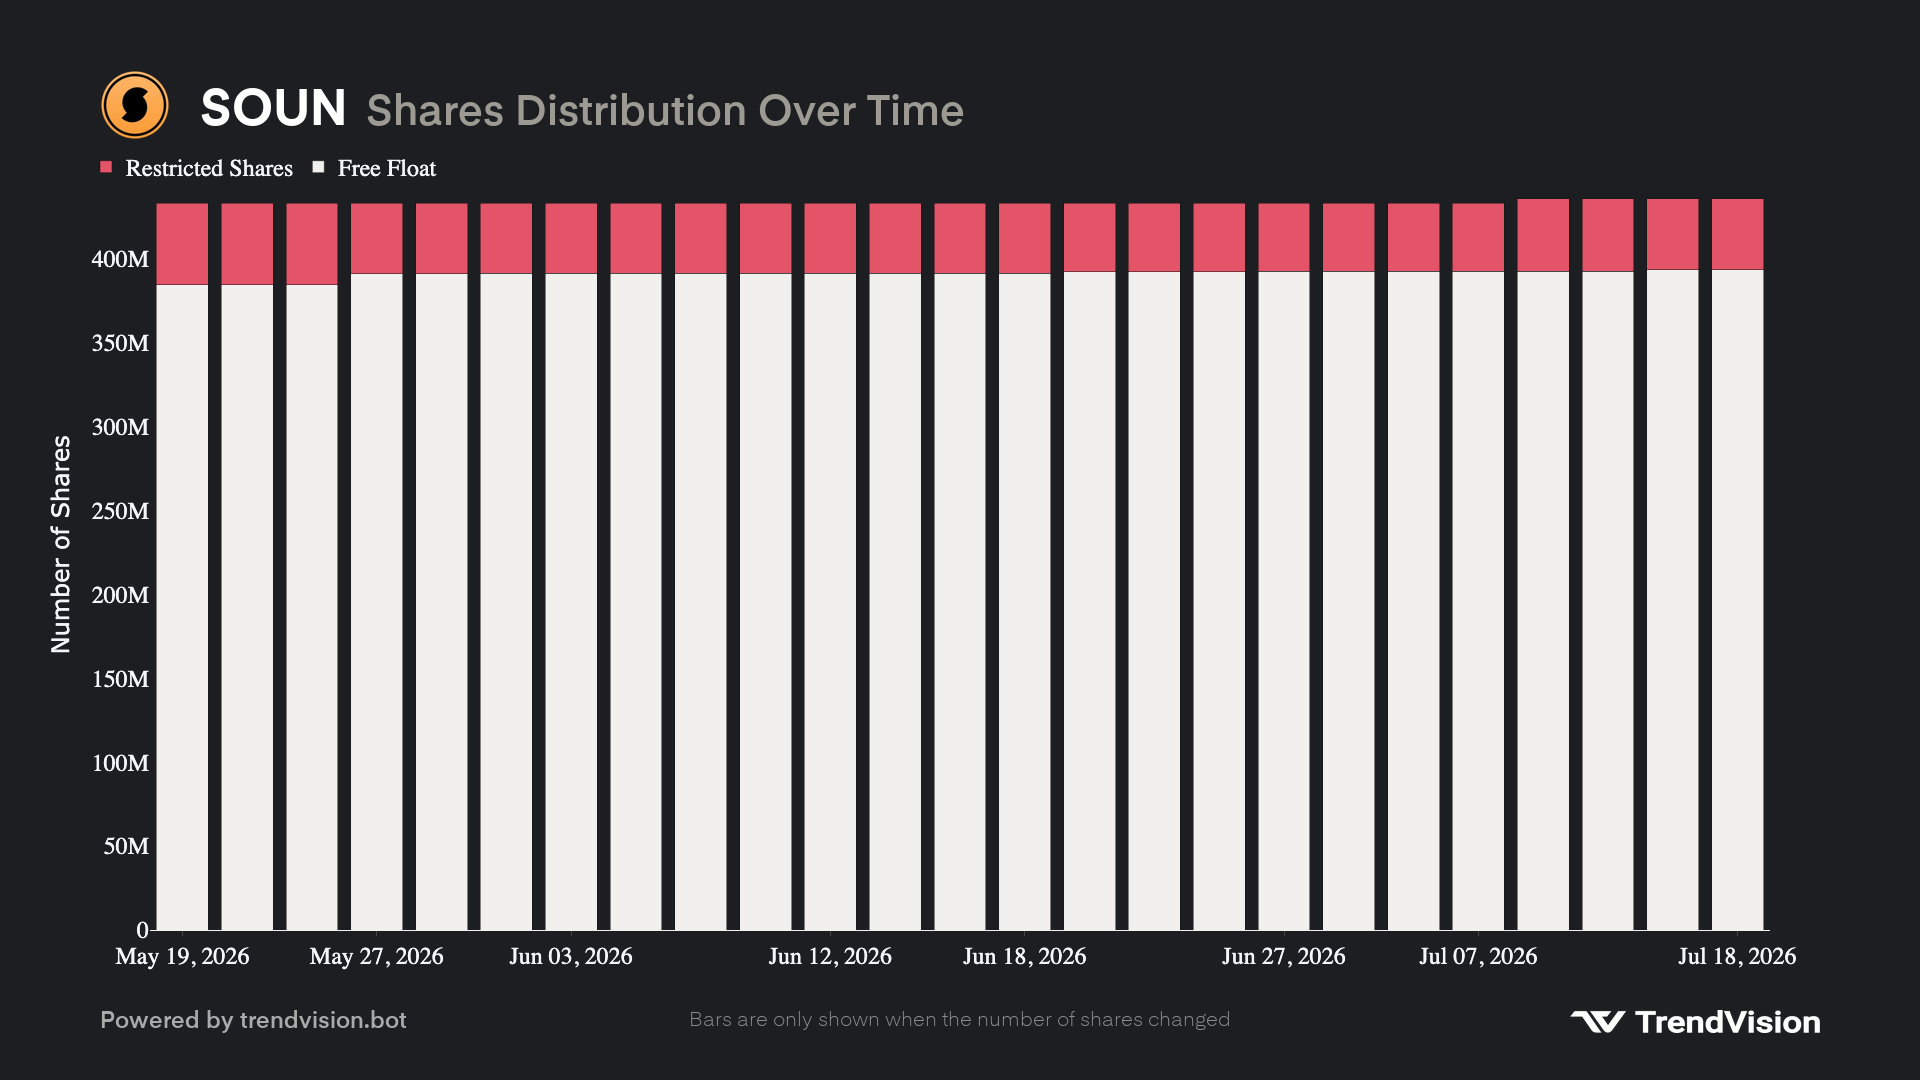
TrendVisionBotToday at 9:30 AM
📎shares-evolution.png
How to use
/shares-evolution <symbol> [bars]| Form | Syntax |
|---|---|
| Slash | /shares-evolution |
| Prefix | ;shares-evolution or ;shares |
Parameters
| Parameter | Required | Accepted values | What it does |
|---|---|---|---|
symbol | Yes | US ticker (AAPL, NVDA, SOFI, …) | Stock to chart. |
bars | No | 20–50 (default 25) | Number of data points to display. Clamped to 20–50. |
Examples
/shares-evolution GME
/shares-evolution AMC 30
;shares NVDA
What you get
PNG image in the channel with a stacked bar chart.
| Segment | Meaning |
|---|---|
| Free Float | Shares available for public trading |
| Restricted Shares | Outstanding minus float (insider/restricted) |
Bars appear only when float or restricted count changed — quiet periods are skipped.
Related commands
/info— current float snapshot/short-interest(/si) — SI % and position history
Notes
- Server channel only.