
/spikes
Historical spike and squeeze events with intraday candle detail.
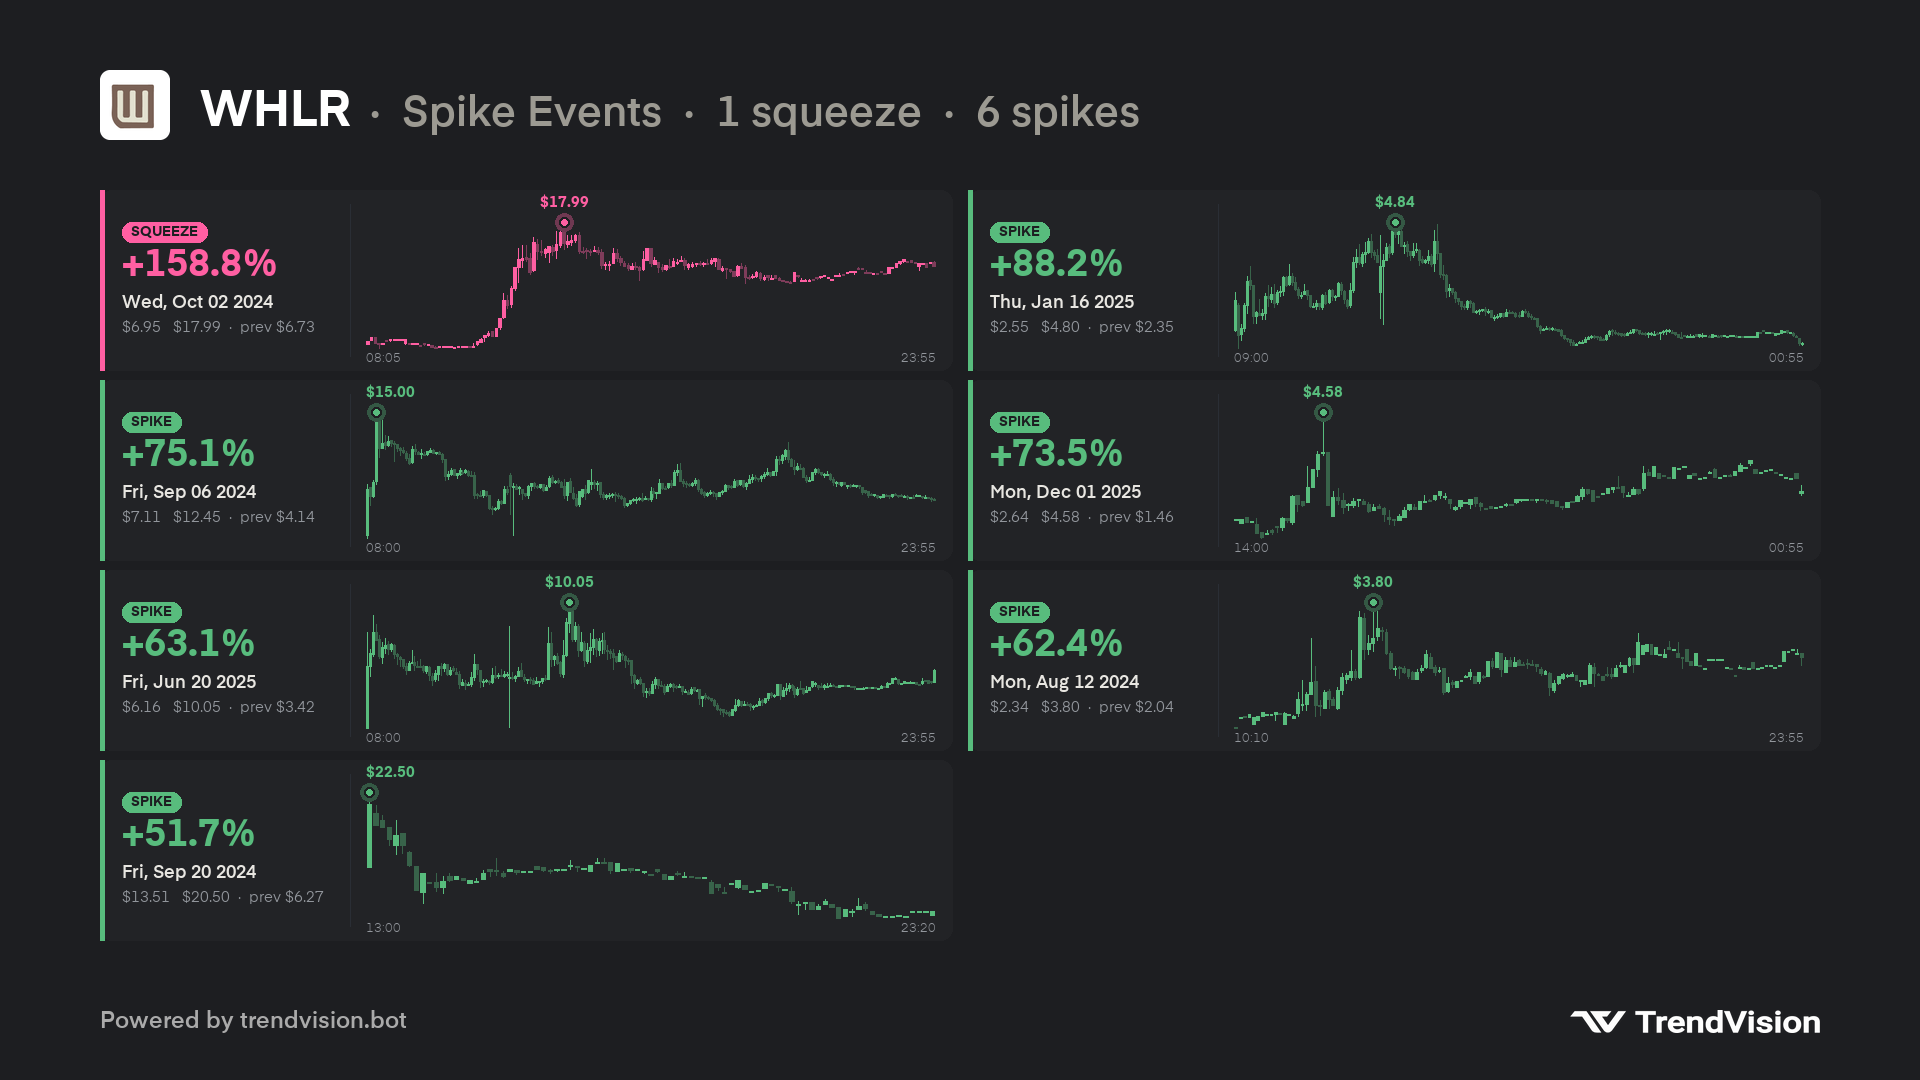
Scans roughly 2 years of daily bars for gap-up days with a huge low-to-high range (spike or squeeze), then renders each event as a card with that session’s intraday 5-minute chart.
Preview
Preview
TrendVisionBotToday at 9:30 AM
📎spikes.png
How to use
/spikes <symbol> [limit]| Form | Syntax |
|---|---|
| Slash | /spikes |
| Prefix | ;spikes |
Parameters
| Parameter | Required | Accepted values | What it does |
|---|---|---|---|
symbol | Yes | US ticker (AAPL, GME, SOFI, …) | Stock to scan. |
limit | No | 1–10 | Max cards to show. Auto-fits up to 10 when omitted. |
Examples
/spikes GME
/spikes AMC 5
/spikes NVDA 10
What you get
PNG image in the channel — one card per event, sorted by largest % move.
Each card shows
| Element | Meaning |
|---|---|
| Badge | SPIKE (green) or SQUEEZE (pink) |
| +% move | Low-to-high range that day ((high − low) / low) after a gap above the prior close |
| Date | Session date |
| Price range | Low → high, with prior close |
| Intraday chart | 5-minute candles for that day, peak marked |
The title summarizes total events found (e.g. squeeze count, spike count, "top N" when truncated). More than 5 cards switches to a compact 2-column layout.
May take a few seconds — the bot defers while fetching daily and intraday data.
Related commands
/squeeze(/ssf) — Squeeze Factor score radar/chart— live price chart with TA overlays
Notes
- Server channel only.
- Lookback: 730 days (~2 years).
- If no events are detected, the image states that explicitly.