
/trades-size-overview
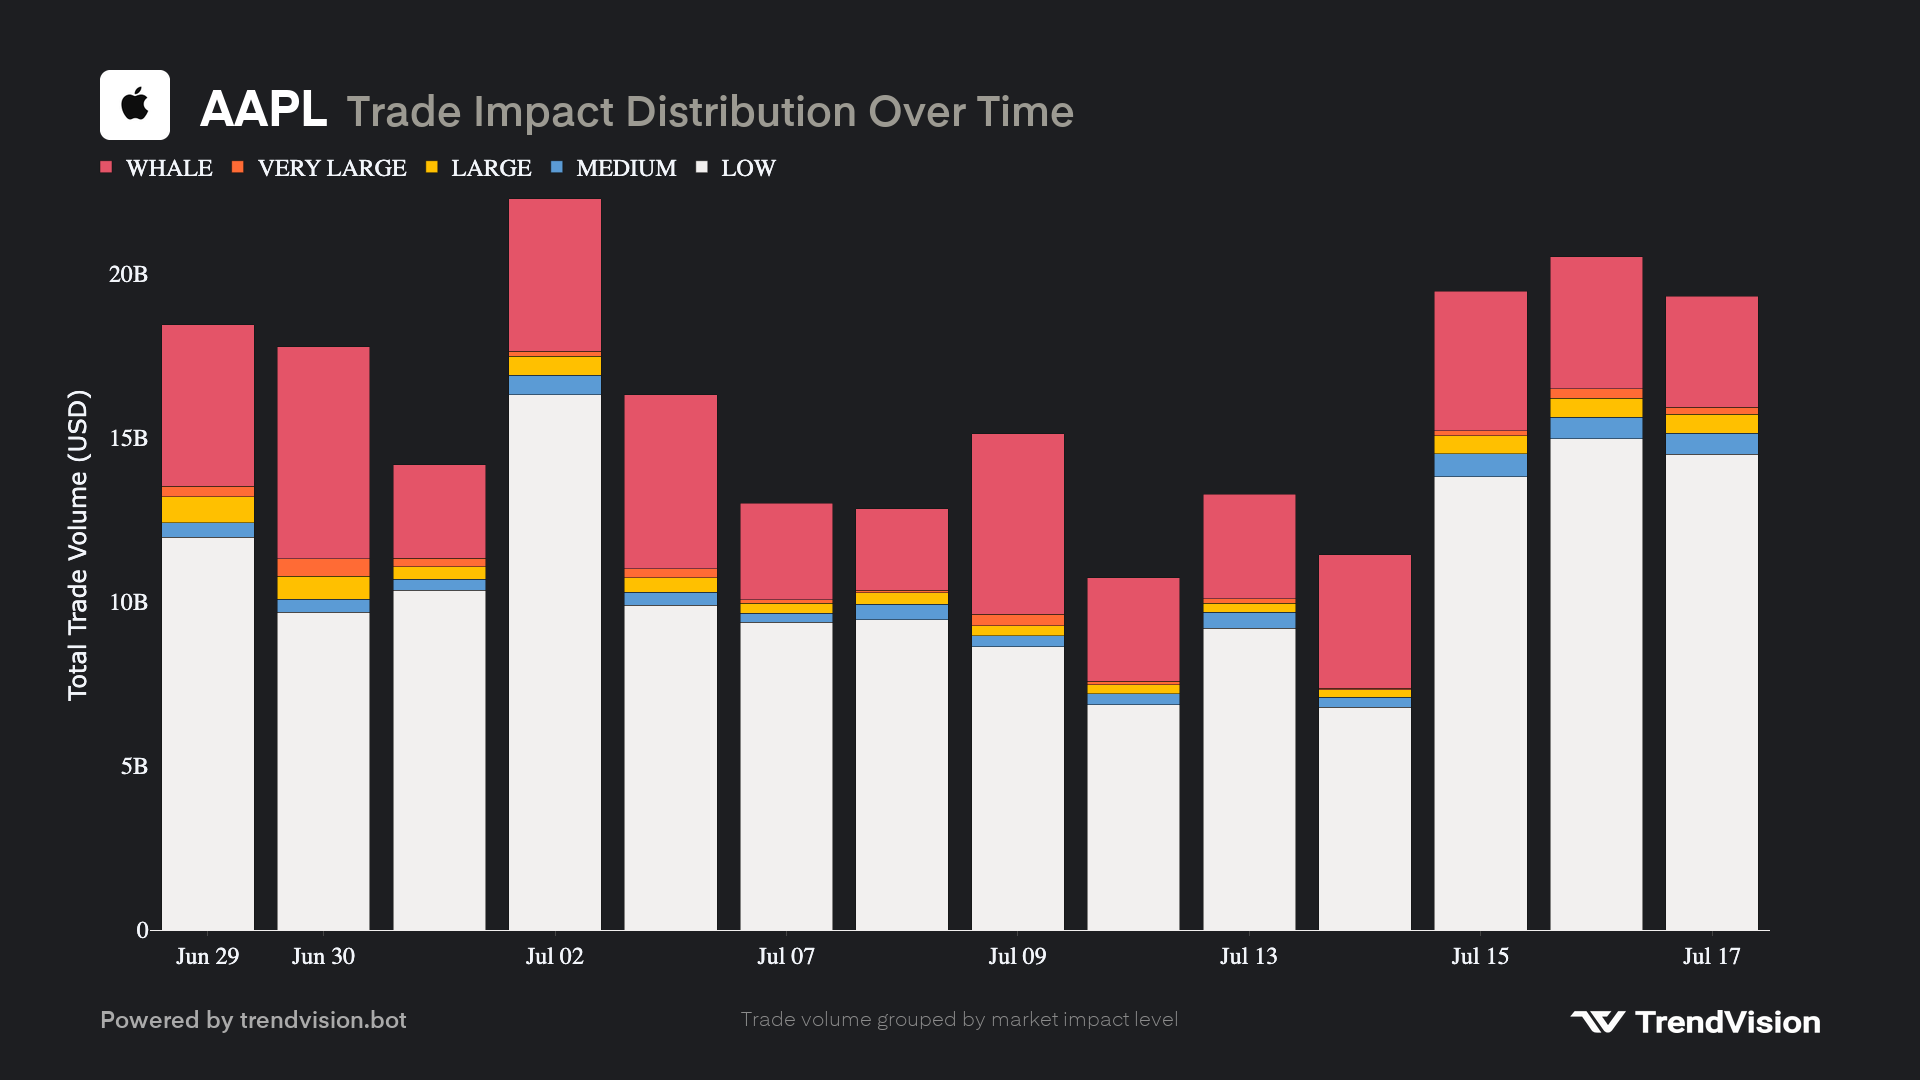
Trade volume stacked by market impact level over time.
Stacked bar chart of dollar volume grouped by impact tier (LOW through WHALE) for each day in the lookback window — see when whales showed up.
Preview
Preview
TrendVisionBotToday at 9:30 AM
📎trades-size-overview.png
How to use
/trades-size-overview <symbol> [days]| Form | Syntax |
|---|---|
| Slash | /trades-size-overview |
| Prefix | ;trades-size-overview or ;tso |
Parameters
| Parameter | Required | Accepted values | What it does |
|---|---|---|---|
symbol | Yes | US ticker (AAPL, NVDA, SOFI, …) | Stock to chart. |
days | No | 10–30 (default 20) | Lookback in calendar days. Clamped to 10–30. |
Examples
/trades-size-overview NVDA
/trades-size-overview GME 30
;tso TSLA
What you get
PNG image in the channel — stacked bars per day.
| Segment | Color tier | Meaning |
|---|---|---|
| LOW | Grey | Smallest impact trades |
| MEDIUM | Blue | Moderate impact |
| LARGE | Yellow | Large impact |
| VERY LARGE | Orange | Very large impact |
| WHALE | Red | Whale-tier notional |
Y-axis: total trade volume in USD. Days with no tape are skipped or cached as zero.
Related commands
/top-trades(/tt) — top 10 trades for a single date/relative-volume(/rvol) — relative volume vs price
Notes
- Server channel only.
- Currently disabled in the bot — may not respond until re-enabled.